Appendix C. Demographic Differences Among Custodial Parents
Table of Contents
Preface: Summary
Introduction
Primary Findings and Results
Hispanic and Asian Child Support Populations
Underlying Population Trends
Methodology
Conclusion
Appendix A: Detailed Tables
Appendix B: Models
Appendix C: Demographic Differences Among Custodial Parents
References
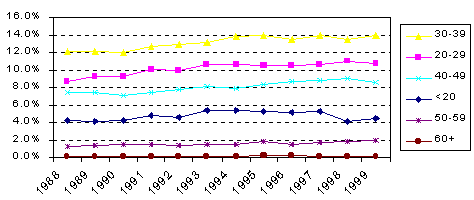
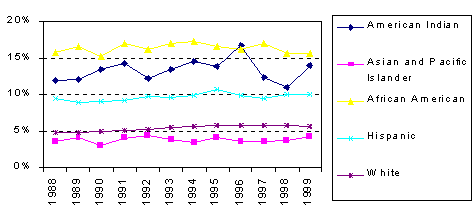
Appendix C. Demographic Differences Among Custodial ParentsIn this appendix, we present some figures that illustrate the dramatic differences in the probability of being a custodial parent according to certain demographic characteristics. These differences are shown for key demographic characteristics and temporal differences are shown for some groups.
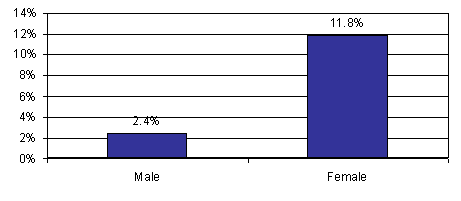
Figure C.1. Percentage of Custodial Parents Among Adults in
1998, by Gender
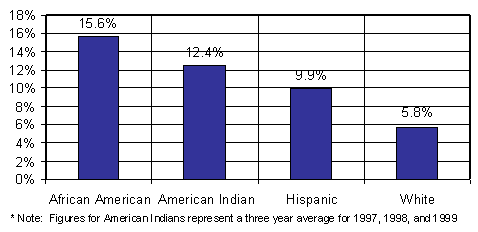
Figure C.2. Percentage of Custodial Parents Among Adults in
1998, by Race/Ethnicity
Figures for American Indians represent a three year average for 1997,1998,1999
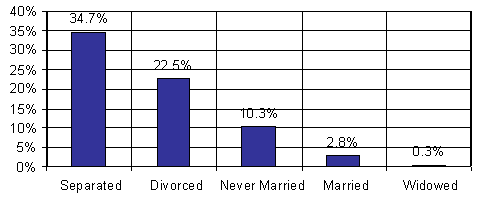
Figure C.3. Percentage of Custodial Parents Among Adults, by
Marital Status
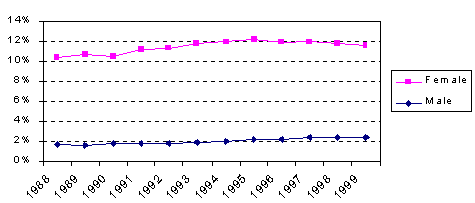
Figure C.4. Percentage of Custodial Parents among Adults, by
Gender
Figure C.5. Percentage of Custodial Parents among Adults, by
Age Group
Figure C.6. Percentage of Custodial Parents among Adults, by
Race/Ethnicity
Table of Contents
Preface: Summary
Introduction
Primary Findings and Results
Hispanic and Asian Child Support Populations
Underlying Population Trends
Methodology
Conclusion
Appendix A: Detailed Tables
Appendix B: Models
Appendix C: Demographic Differences Among Custodial Parents
References
|
||||||||||||||||||
